Profiling
Profiling Scheduler
Use pprof to do CPU, Memory profiling can help you understand the runtime status of YuniKorn scheduler. Profiling instruments have been added to YuniKorn rest service, we can easily retrieve and analyze them from HTTP endpoints.
CPU profiling
At this step, ensure you already have YuniKorn running, it can be either running from
local via a make run command, or deployed as a pod running inside of K8s. Then run
go tool pprof http://localhost:9080/debug/pprof/profile
The profile data will be saved on local file system, once that is done, it enters into the interactive mode. Now you can run profiling commands, such as
(pprof) top
Showing nodes accounting for 14380ms, 44.85% of 32060ms total
Dropped 145 nodes (cum <= 160.30ms)
Showing top 10 nodes out of 106
      flat  flat%   sum%        cum   cum%
    2130ms  6.64%  6.64%     2130ms  6.64%  __tsan_read
    1950ms  6.08% 12.73%     1950ms  6.08%  __tsan::MetaMap::FreeRange
    1920ms  5.99% 18.71%     1920ms  5.99%  __tsan::MetaMap::GetAndLock
    1900ms  5.93% 24.64%     1900ms  5.93%  racecall
    1290ms  4.02% 28.67%     1290ms  4.02%  __tsan_write
    1090ms  3.40% 32.06%     3270ms 10.20%  runtime.mallocgc
    1080ms  3.37% 35.43%     1080ms  3.37%  __tsan_func_enter
    1020ms  3.18% 38.62%     1120ms  3.49%  runtime.scanobject
    1010ms  3.15% 41.77%     1010ms  3.15%  runtime.nanotime
     990ms  3.09% 44.85%      990ms  3.09%  __tsan::DenseSlabAlloc::Refill
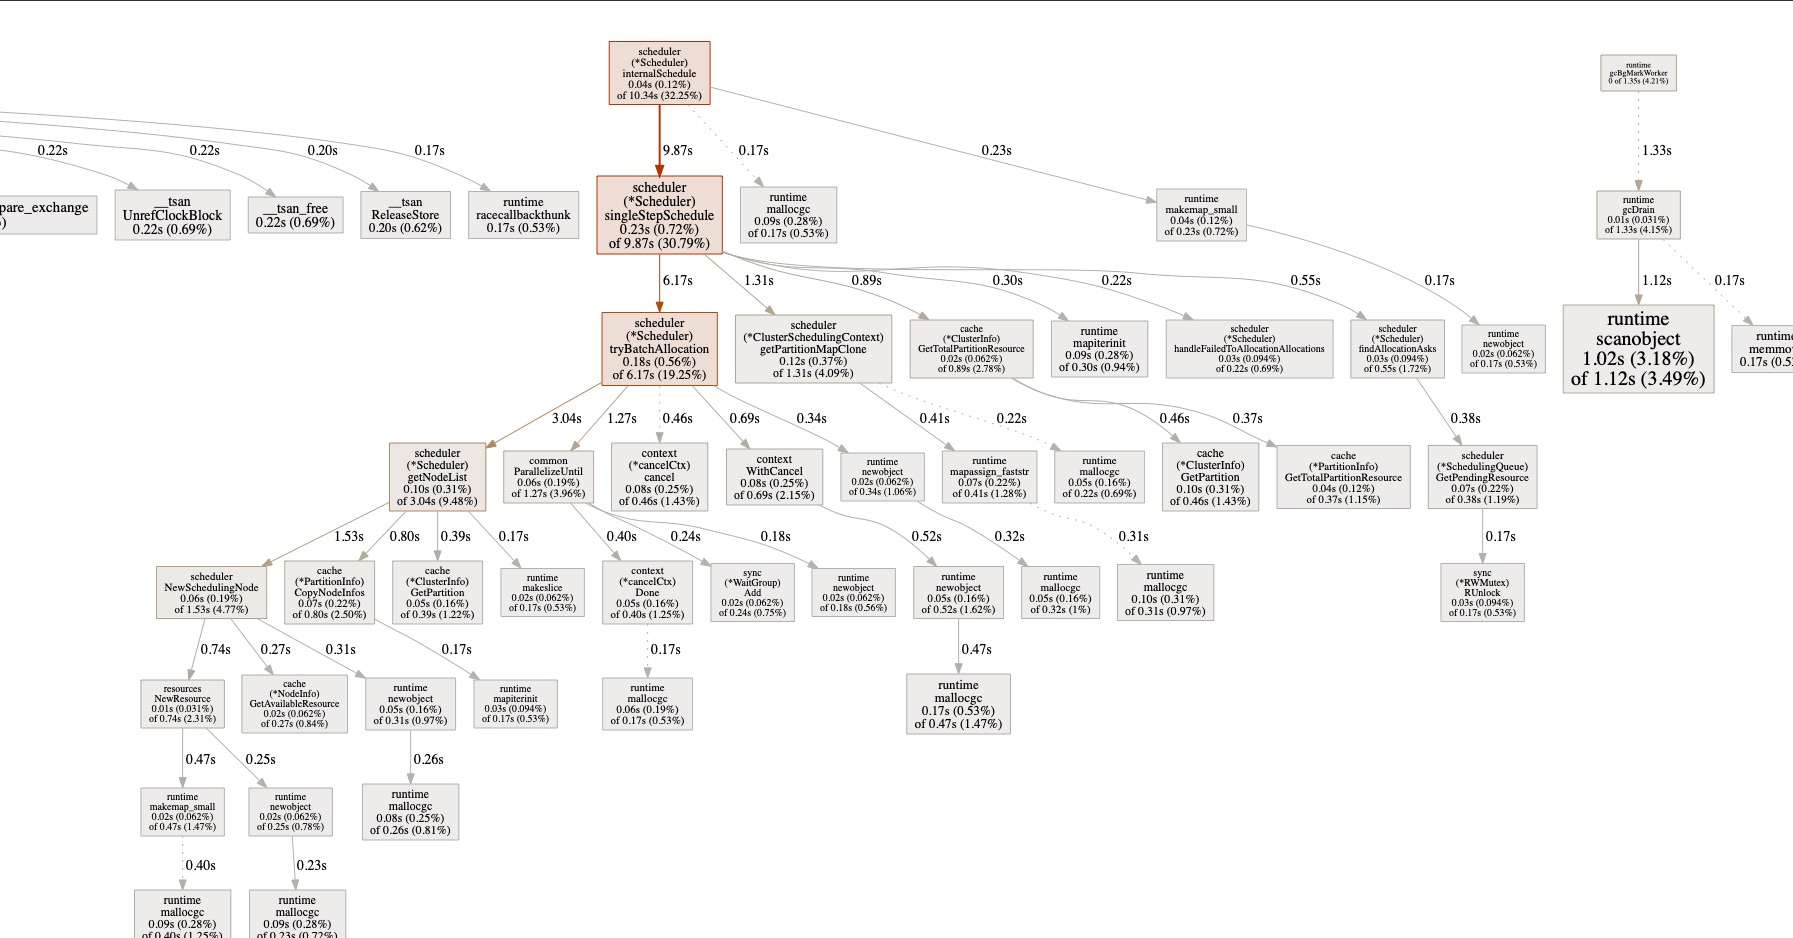
you can type command such as web or gif to get a graph that helps you better
understand the overall performance on critical code paths. You can get something
like below:
Note, in order to use these
options, you need to install the virtualization tool graphviz first, if you are using Mac, simply run brew install graphviz, for more info please refer here.
Memory Profiling
Similarly, you can run
go tool pprof http://localhost:9080/debug/pprof/heap
this will return a snapshot of current heap which allows us to check memory usage. Once it enters the interactive mode, you can run some useful commands. Such as top can list top memory consumption objects.
(pprof) top
Showing nodes accounting for 83.58MB, 98.82% of 84.58MB total
Showing top 10 nodes out of 86
      flat  flat%   sum%        cum   cum%
      32MB 37.84% 37.84%       32MB 37.84%  github.com/apache/incubator-yunikorn-core/pkg/cache.NewClusterInfo
      16MB 18.92% 56.75%       16MB 18.92%  github.com/apache/incubator-yunikorn-core/pkg/rmproxy.NewRMProxy
      16MB 18.92% 75.67%       16MB 18.92%  github.com/apache/incubator-yunikorn-core/pkg/scheduler.NewScheduler
      16MB 18.92% 94.59%       16MB 18.92%  github.com/apache/incubator-yunikorn-k8shim/pkg/dispatcher.init.0.func1
    1.04MB  1.23% 95.81%     1.04MB  1.23%  k8s.io/apimachinery/pkg/runtime.(*Scheme).AddKnownTypeWithName
    0.52MB  0.61% 96.43%     0.52MB  0.61%  github.com/gogo/protobuf/proto.RegisterType
    0.51MB  0.61% 97.04%     0.51MB  0.61%  sync.(*Map).Store
    0.50MB   0.6% 97.63%     0.50MB   0.6%  regexp.onePassCopy
    0.50MB  0.59% 98.23%     0.50MB  0.59%  github.com/json-iterator/go.(*Iterator).ReadString
    0.50MB  0.59% 98.82%     0.50MB  0.59%  text/template/parse.(*Tree).newText
you can also run web, pdf or gif command to get the graph for heap.
Download profiling samples and analyze it locally
We have included essential go/go-tool binaries in scheduler docker image, you should be able to do some basic profiling analysis inside of the docker container. However, if you want to dig into some issues, it might be better to do the analysis locally. Then you need to copy the samples file to local environment first. The command to copy files is like following:
kubectl cp ${SCHEDULER_POD_NAME}:${SAMPLE_PATH_IN_DOCKER_CONTAINER} ${LOCAL_COPY_PATH}
for example
kubectl cp yunikorn-scheduler-cf8f8dd8-6szh5:/root/pprof/pprof.k8s_yunikorn_scheduler.samples.cpu.001.pb.gz /Users/wyang/Downloads/pprof.k8s_yunikorn_scheduler.samples.cpu.001.pb.gz
once you get the file in your local environment, then you can run the pprof command for analysis.
go tool pprof /Users/wyang/Downloads/pprof.k8s_yunikorn_scheduler.samples.cpu.001.pb.gz
Resources
- pprof Document https://github.com/google/pprof/tree/master/doc.